Deep Dive
Structured diagnostic workflows for the most challenging fault categories. Use alongside the DiagFlow app for systematic, never-miss-a-step diagnosis.
Diagnostic Workflow Categories
Select a workflow below to access the full step-by-step procedure.
1
Network Diagnostics
CAN / LIN / FlexRay
2
Misfire Diagnostics
Coming Soon
3
Fuel Trims
Rich / Lean – Coming Soon
4
Diesel / EGR
Exhaust Aftercare – Coming Soon
5
Electrical
Voltage / Short / Basics – Coming Soon
Network Diagnostics
CAN / LIN / FlexRay communication fault diagnosis
Step 1 – Determine Complaint & Communication Status
Determine complaint, codes, operation, and warning lights. Confirm scan tool communication with all modules. Try OEM and global scan tools.
- If no-comm at OBD: check pin tension/condition and run 60 Ohms test
- Try hard-wiring further into the network
- Consider gateway issues (See Topology)
Pro Tip: Before replacing any module, bench test first. Check software levels, powers, grounds, and comm lines.
Step 2 – Determine Network & Topology
Use wiring diagrams to identify the network type and topology. Map out which modules are on which network legs.
- Fill out a Network Identification Chart – list all modules and their DTCs
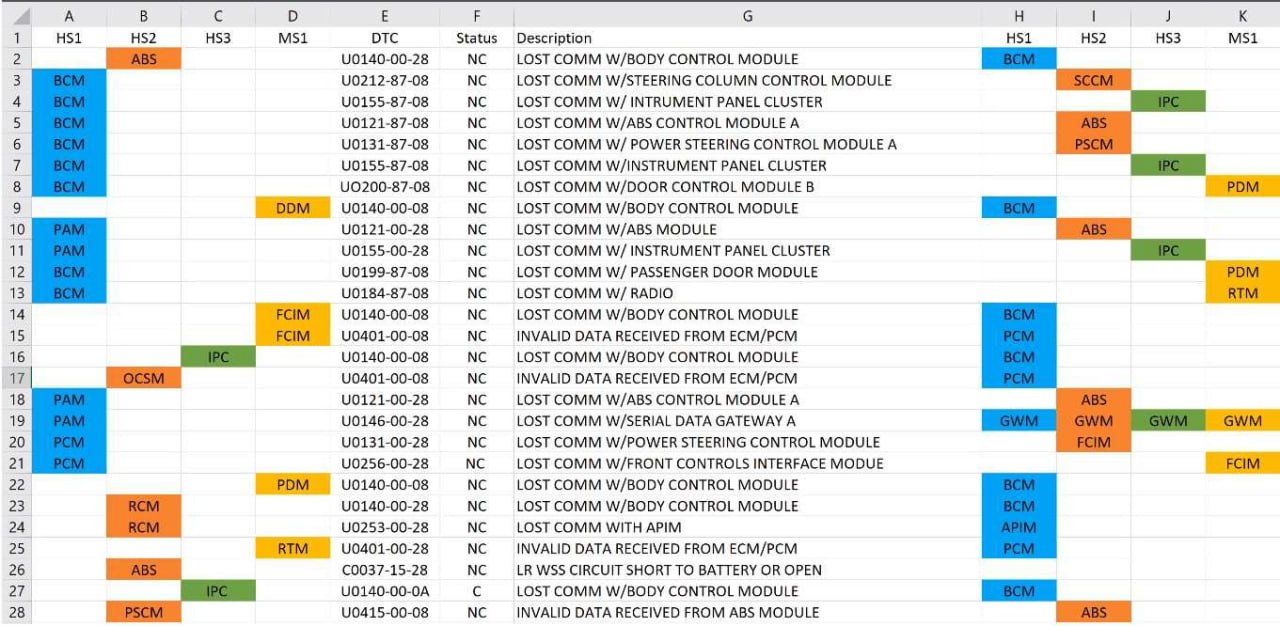
This spreadsheet example is used to very good effect. This is a great way to “sort out” all the DTCs and determine which modules and network legs the DTCs are indicating, and which modules are calling faults on multiple network branches. The idea here is to find the commonality of DTCs and isolate where you need to start with your physical testing. This can be a quick and productive way to compliment your approach to multi-DTC communications faults. By utilizing the scanner, this type of spreadsheet, your schematics and your lab scope, you will be able to quickly jump on and target your area of fault. This course will leverage tools and strategies such as this to help improve your communications diagnostic productivity and prevent misdiagnosis.
HT Adam — Diagnation — adam@diagnation.com
📄 Download Network ID Chart Template (.xlsx) - Look for modules calling faults on multiple branches
- Record ALL codes before clearing
Pro Tip: Broken modules may not tell on themselves. Codes in other modules will. Seems backwards – but its not.
Step 3 – Gather Network Waveforms – 3 Failure Layers
Connect lab scope to the network in multiple locations. Classify the failure into one of three layers:
- Physical Layer – anything you can TOUCH: wiring, connectors, terminating resistors
- Transport Layer – packet structure and function: frame timing, arbitration, acknowledgment
- Software Layer – I/O logic and programming: module calibration, configuration, programming errors
Pro Tip: If using PicoScope, run in deep record or anti-PicoGap mode. Leave scope connected during all operations including test drives.
Step 4 – Utilize Scan Tool Network Diagnostic Menus
Access network diagnostic menus. Perform module-specific tests. Clear codes in each individual module if necessary.
- Perform functional tests and test drives
- Re-check for codes after each operation
- Clear individually – global clear may not reach all modules
Step 5 – Network Logical Diagnostic Approach
Record all DTCs and determine which modules and network legs are indicated. Find the commonality.
- Identify modules calling faults on multiple network branches
- Use this to isolate where to start physical testing
- Combine scanner data, network chart, schematics, and lab scope
Pro Tip: A well-executed DTC sort can quickly identify your target area and prevent misdiagnosis.
Use These Workflows Live in the App
Access all Diagnostic Workflows during your diagnosis inside DiagFlow. Open any Step 8, 9, or 10 and tap Open Diagnostic Workflows.
 DiagFlow.org